30–40% of premium perks at 30% of the cost — for customers who already use credit responsibly, but are priced out of $550 cards.
Premium cards are built for the affluent.
Subprime cards are built for the desperate.
Mid-tier cards try to be everything to everyone.
But there’s a fourth group in the middle — a massive, overlooked segment:
- They revolve modestly, not recklessly.
- They pay consistently on time.
- Their scores are dragged down by utilization or short history, not by chronic delinquency.
- They want premium-adjacent experiences at a realistic, fair price.
This article proposes a new category:
The Elevate Class Card
A semi-premium tier priced at 199, delivering lifestyle upgrades and meaningful rewards — with fair, transparent economics that create lifetime value and strong risk-adjusted profitability for issuers.
The design is value-aligned and transparent: the customer gets real upgrades; the issuer gets real economics. No games.

1. The Missing Middle of Credit Cards
The portfolio shape today is skewed toward the extremes:
-
Premium (695+)
- Unlimited lounges, concierge, luxury benefits
- Underwritten and priced for high-spend, low-revolve, high-FICO customers
-
Mid-tier (150)
- Solid multipliers, decent perks, mass-market targeting
- Built more for affordability than aspiration
-
No-fee cards
- Basic cashback or points
- No meaningful status or experience
-
Subprime / retail cards
- 25–35% APRs, low limits, almost no perks
- Focused on risk containment, not lifestyle
Missing entirely:
A product designed for the “credit middle class” — responsible, early-prime revolvers who:
- Can afford more than $95
- Can’t justify $550+
- Already generate significant interest + interchange
- Want to feel elevated, not generic
That’s where Elevate Class fits.

2. Who Is the Elevate Class Customer?
2.1 Behavioral & Financial Profile
-
Age: 24–40
- Young to mid-career, still building wealth and credit depth.
-
Income: $45k–$100k
- Stable but not affluent; enough to sustain moderate annual fees plus discretionary spend.
-
FICO: 650–720
- Early-prime bracket: not subprime, not top-tier; constrained more by history and utilization than by defaults.
-
Credit history: 1–5 years
- Thin to moderate history, typical of younger professionals or recent immigrants.
-
Utilization: 30–50% on revolving lines
- Actively using credit; not ideal from a score perspective, but still controlled.
-
Payment history: 97–100% on-time over last 24 months
- Strong reliability; low default risk if underwritten sanely.
-
Revolving pattern:
- Revolves a balance most months
- Pays more than minimum but less than full statement
- Classic responsible revolver behavior.
-
Monthly new spend (S): ~$1,200
- Represents everyday + discretionary spend for urban/aspirational customers.
-
Average revolving balance (B): ~$1,500
- Represents multi-month carried balance after partial repayments — not one month’s spend.
Example timeline (to make it concrete):
- Month t–1 ending balance: $900
- Month t new spend: $1,200
- Statement: $2,100
- Customer pays: $600
- New revolving balance: $1,500 (account is current, not in default)
2.2 Psychographic Profile
- Aspirational, not elite
- Wants to “feel premium” in airports, dining, events
- Wants a card that signals progress, not struggle
- Values fairness and clarity more than teaser gimmicks
This segment is profitable + low default risk if selected using proper analytics.
3. The Elevate Class Concept
A new tier between mid-tier and premium, priced at $99–$199, offering 30–40% of premium perks at <40% of the price.
3.1 Core Positioning
“Premium-style experiences for the credit middle class — at one-third the price of top-tier cards, with fair, transparent terms.”
3.2 Perk Stack (with One Truly Unique Privilege)
We’ll design three tiers: Elevate 100, 150, 200 — but focus on Elevate 150 as the flagship.
Annual Fee Bands (each with a clear role):
- Elevate 100 – $99
Entry semi-premium tier: basic lounge access + credits. - Elevate 150 – $149
Flagship: best mix of benefits and adoption. - Elevate 200 – $199
Richest experiences and exclusivity-focused features.
Flagship Elevate 150 Perks:
-
Lounge Access: 3 visits/year
- Enough to feel premium; limited to control costs.
-
Events & Entertainment: curated drops
- Presale access to concerts
- Occasional discounted tickets
-
Lifestyle Credits
- $10/month dining credit (up to $120/year)
- $5/month transit/rideshare credit (up to $60/year)
- High perceived value; real cost lower due to breakage and partner funding.
-
Rewards Earning
- 3x dining
- 2x travel & transit
- 1x everything else
- Standard but attractive earn table.
-
Premium-Plus Perk: “Elevate Experience + Advisory”
This is the differentiator — something even many premium cards don’t package together:-
Annual “Elevate Experience Drop”
- One curated high-end experience (e.g., hotel night, chef’s tasting menu, immersive event) co-designed with partners.
- Perceived value: $200–$300; issuer cost: maybe $20–$30 via negotiated rates.
-
Annual 1:1 “Financial Elevation Review”
- A 30–45 minute session with a trained advisor (or advanced in-app guidance) using the customer’s data to:
- Optimize their debt strategy
- Improve their credit profile over time
- Plan how to “graduate” into better terms & products
- Perceived value: high; marginal cost: $10–$20 per engaged customer.
- A 30–45 minute session with a trained advisor (or advanced in-app guidance) using the customer’s data to:
Together, this creates a unique privilege: not just access and rewards, but proactive financial uplift — rare even in the premium space.
-
APR & Terms (Ethical Guardrails):
- APR band: 22–25% variable, consistent with semi-premium rewards cards for this risk band.
- No gimmicky “bonus points for carrying a balance.”
- Full compliance with CARD Act (disclosure, fee reasonableness, penalty APR rules).
- Clear, upfront explanation of how interest works and how to avoid it.

4. Base-Case Unit Economics (All Math Checked)
Now we quantify the economics for Elevate 150 with clearly explained metrics.
4.1 Core Behavioral Inputs (Flagship Tier)
-
Monthly new spend (S): $1,200
This is typical for a young urban professional using the card for daily + discretionary spend. -
Average revolving balance (B): $1,500
Multi-month carried balance after partial repayments; not a single month of spend. -
APR: 24%
Mid-range APR for a rewards card in this risk band — not penalty-level, not ultra-low. -
Net interchange rate: 1.7%
Issuer’s approximate blended revenue share after network fees and interchange splits.
4.2 Revenue Calculations
Interest Revenue (IR):
- Represents annual interest collected from the average carried balance.
Interchange Revenue (IC):
- Represents the issuer’s net revenue from merchant fees across all transactions.
Annual Fee (AF):
- AF = $149
Flagship pricing in the semi-premium band.
Total Gross Revenue (GR):
4.3 Cost Assumptions (With One-Line Explanations)
All costs below are annual per active account estimates.
-
Rewards Cost: $70
Issuer cost of points/cashback after breakage, based on the earn table and typical redemption behavior. -
Lounge & Experiences: $35
Blended cost of 3 lounge visits + some small event/entertainment benefits, at negotiated partner rates. -
Lifestyle Credits: $55
Net cost after breakage and partner subsidies on dining and transit credits. -
Partner-Funded Perks: $10
Residual cost for brand and merchant offers not fully covered by partner marketing budgets. -
Elevate Experience + Advisory: $20
Average cost of the annual curated experience and advisory session, net of partner co-funding and opt-in rates. -
Servicing & Overhead: $40
Customer service, statements, platform costs, and regulatory overhead per active account. -
Expected Credit Losses: $45
Expected annual net charge-offs for this relatively low-risk segment. -
CAC Amortized: $40
Customer acquisition cost spread over an average 3–4 year life.
Total Cost (TC):
- This is the full loaded cost including benefits, risk, and operational overhead.
4.4 Net Contribution (Flagship Elevate 150)
Rounded: $440 per active account per year.
That is very strong unit profitability — and it’s achieved without abusive fees or APRs.
5. Pricing the Elevate Family: A Structured Mockup
Now let’s see how the economics shift across $99, $149, $199.
We keep behavioral inputs fixed (same customer) and adjust benefit costs.
5.1 Elevate 100 ($99 AF) – Entry Semi-Premium
- AF: $99
- Perks: fewer lounge visits, slightly smaller lifestyle credits, lighter unique perk.
Cost Assumptions:
- Rewards: $65
- Lounge/experiences: $25
- Lifestyle credits: $45
- Partner perks: $10
- Premium+ perk: $10
- Servicing: $40
- Losses: $45
- CAC amortized: $40
Gross Revenue (same IR & IC as before):
Net Contribution:
- Entry tier still delivers ~$424 per account per year, while giving aspirational customers a lower AF on-ramp.
5.2 Elevate 150 ($149 AF) – Flagship (Already Computed)
-
GR₁₅₀ = 754
-
TC₁₅₀ = 315
-
NC₁₅₀ = 754 – 315 = 439
-
Sweet spot between customer-perceived value and profitability.
5.3 Elevate 200 ($199 AF) – Richest Experiences
- AF: $199
- Perks: more lounge visits, higher lifestyle credits, more premium “Elevate Experience” options.
Cost Assumptions:
- Rewards: $80
- Lounge/experiences: $45
- Lifestyle credits: $70
- Partner perks: $15
- Premium+ perk: $30
- Servicing: $40
- Losses: $45
- CAC amortized: $40
Gross Revenue:
Net Contribution:
- Elevate 200 offers richer value and a higher fee; unit contribution is similar to 150 but with skew toward more affluent aspirational users.
5.4 Pricing Takeaways
- All three tiers are healthy from a unit economics standpoint.
- Elevate 150 defines the core proposition; 100 and 200 are flanking options.
- Customers at different income & willingness-to-pay levels can self-select into the band that fits them, without breaking the economics.
This is how an issuer can justify the $99–$199 range quantitatively instead of guessing.
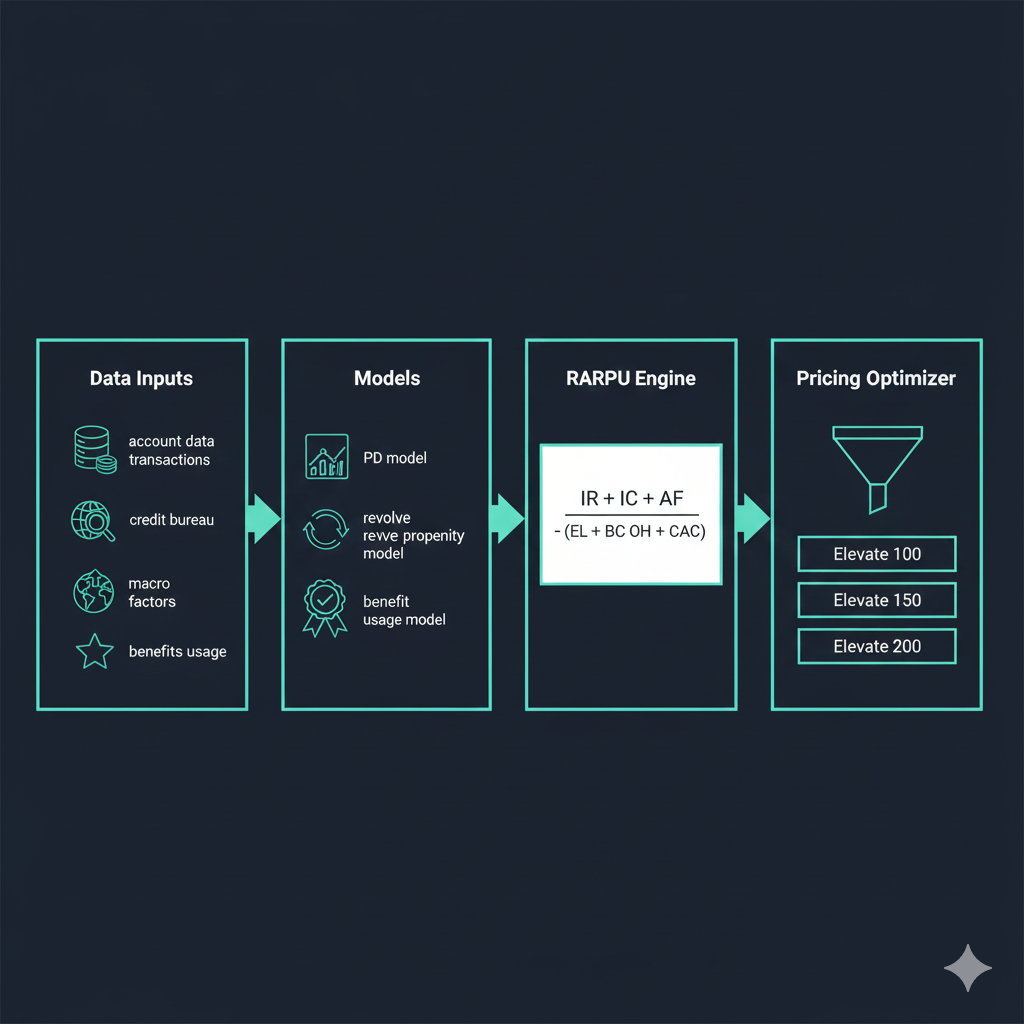
6. Analytical Pricing & Modeling Framework
If a bank actually wants to launch an Elevate-type product, “$99–$199 feels right” is not a strategy. You need a full analytical stack:
- Clear metrics and formulas
- The right data and feature engineering
- Robust risk and behavior models
- A RARPU engine (risk-adjusted revenue per user)
- A pricing optimizer that searches fee / APR / perk combinations
This section walks through that stack with concrete numbers.
6.1 Core Metrics (Each With a One-Line Explanation)
These are the building blocks of Elevate pricing.
-
PD (Probability of Default)
Chance (0–1) that a customer will charge off within a selected horizon (e.g., 12 or 24 months). -
EAD (Exposure at Default)
Expected outstanding balance if/when the customer defaults. -
LGD (Loss Given Default)
Share (0–1) of the defaulted balance the issuer ultimately loses after recoveries. -
Expected Loss (EL)
Expected dollar loss from credit risk: -
Revolve Propensity (RP)
Likelihood (0–1) that a customer will regularly carry a balance instead of paying in full. -
Average Revolving Balance (B)
Average balance the customer carries month-to-month over a year (after partial repayments). -
Monthly Spend (S)
Average new card spend per month across all categories. -
Interest Revenue (IR)
Expected annual interest income from revolving balance: -
Interchange Revenue (IC)
Expected annual net merchant fee income: -
Benefit Cost (BC)
Expected annual cost of all rewards, credits, lounges, and experiential perks consumed. -
Overhead (OH)
Allocated annual cost per active account for servicing, operations, compliance, and infrastructure. -
CAC (Customer Acquisition Cost)
Cost to acquire the customer, amortized per year over expected lifetime. -
RARPU (Risk-Adjusted Revenue Per User)
Core profitability metric per customer: -
LTV (Lifetime Value)
Discounted sum of future RARPU across the customer’s expected relationship:where r is a discount rate and T is expected life in years.
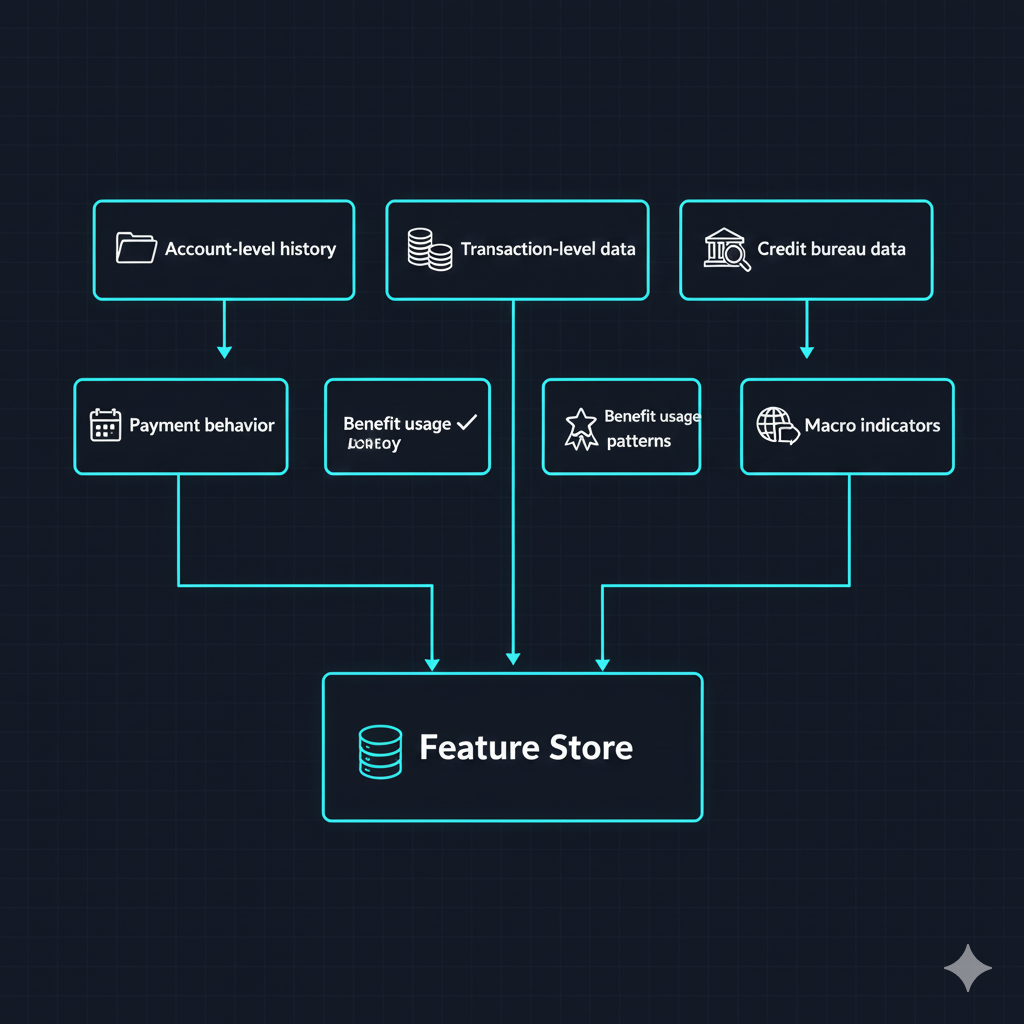
6.2 Data Needed (What You Actually Pull)
To build Elevate pricing correctly, an issuer needs at least:
1. Account-Level Data
- Current and historical balances
- Credit limits and utilization
- Payment histories (on-time, DPD buckets, charge-offs)
- Fee assessment and waiver patterns
- Product type, tenure, upgrades/downgrades
2. Transaction-Level Data
- Timestamp, MCC (merchant category code), amount
- Channel (in-store vs e-commerce)
- Geography (country, region, ZIP)
- One-off vs recurring merchants (subscriptions, utilities, etc.)
3. Credit-Bureau & Application Data
- FICO and its history (trend, volatility)
- Number and mix of tradelines (cards, loans, mortgages)
- Age of oldest tradeline, average age
- Income band and employment status
- Housing (rent/own, estimated payment)
4. Offer & Campaign Data
- Which offers the customer has seen
- Which they accepted, and how they responded
- Prior promo APR or BT conversions
- Upgrade/downgrade conversions
5. Benefit Usage Data
- Lounge entry records
- Dining and lifestyle credits issued vs redeemed
- Experience drops and event redemptions
- Campaign-specific perks used
6. Macro & Segment Overlays
- Regional unemployment rates
- Industry/occupation risk (e.g., cyclic sectors)
- Economic stress indicators by region or segment
6.3 Feature Engineering (Turning Raw Data Into Signals)
Models aren’t fed raw balances; they consume engineered features that capture behavior.
For PD (Risk) Models:
- Rolling 3/6/12-month utilization (mean, max, volatility)
- Number of months above 80% utilization in last 12 months
- DPD flags (30/60/90 days past due) and recency
- Number of charge-offs, bankruptcies, collections in file
- Score trajectory: ΔFICO (12 months), ΔFICO (24 months)
- Tradeline depth: count, mix (cards vs loans), average age
- Region × macro factors (local unemployment, industry stress)
For Revolve Propensity Models:
- Fraction of months in past 12 months with non-zero revolve
- Fraction of months with revolve > $X (e.g., $500, $1,000)
- Average payment-to-statement-balance ratio
- Minimum-payment-only frequency
- Prior acceptance of 0% APR / BT offers
- Spend volatility: standard deviation of monthly spend
- Share of spend in discretionary categories (dining, travel, entertainment, luxury retail)
For Benefit Usage & Cost Models:
- Past lounge usage if any (visits/year)
- Travel frequency (airline + hotel + transit MCCs per year)
- Prior engagement with dining offers or statement credits
- Distance to major airports (geo-based proxy for lounge likelihood)
- Response rates to past “experience”-type offers
These features let you estimate Bᵢ, Sᵢ, BCᵢ, and ELᵢ realistically.
6.4 Model Choices (What to Use for What)
You don’t need exotic deep learning; you need robust, explainable models.
6.4.1 PD (Probability of Default) Model
- Goal: Predict default (charge-off) within a 12–24 month horizon.
- Typical models:
- Logistic regression: easier to explain to regulators.
- Gradient boosting (XGBoost/LightGBM): better performance, with explainability via SHAP.
- Key output: PDᵢ (per-customer default probability), potentially under multiple macro scenarios.
6.4.2 Revolve Propensity Model
- Goal: Predict whether a customer will revolve under Elevate and how consistently.
- Models:
- Gradient boosting: captures nonlinear relationships (e.g., a combination of income, utilization, and spend volatility).
- GAM (Generalized Additive Models): if you want smooth, interpretable effects.
- Outputs:
- RPᵢ: probability of being a revolver
- Expected average Bᵢ (revolving balance) as a function of limit, income, and behavior.
6.4.3 Benefit Usage & Cost Models
- Goal: Predict usage and cost of each benefit category.
- Models:
- Classification (logistic): “Will this customer use lounges at least once a year?”
- Count models (Poisson/negative binomial or GBM): “How many visits per year?”
- Regression: “What fraction of dining credits are likely to be redeemed?”
- Outputs:
- Expected lounge visits × cost per visit
- Expected redeemed credits × net cost per dollar
- Expected take-up for experience drops × cost per redemption
- Summed up into an annual BCᵢ (benefit cost per customer).
6.4.4 RARPU & LTV Engine
- Goal: Convert all model outputs into dollars of profit per user.
- Implementation: Deterministic math over predicted variables:
- IRᵢ from Bᵢ and APR grid
- ICᵢ from Sᵢ and interchange rate
- AFᵢ from the chosen fee tier
- BCᵢ, ELᵢ, OHᵢ, CACᵢ from respective models and assumptions
- RARPUᵢ from the equation above
- LTVᵢ from multi-year RARPUᵢ sequences
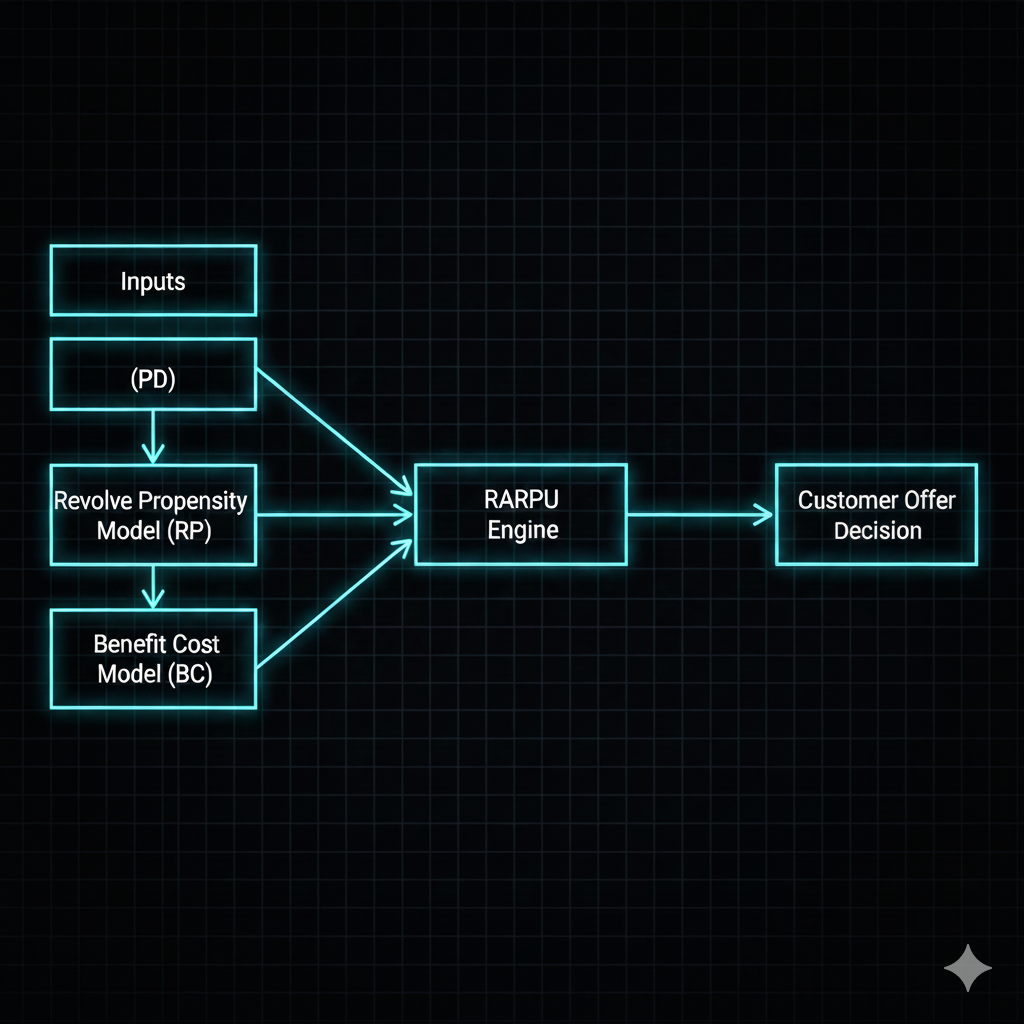
This is where pricing decisions become quantified, not guessed.
6.5 Mock RARPU Calculations for Three Customer Types
To make this concrete, let’s simulate three customers under Elevate 150:
- AF = $149
- APR = 24%
- InterchangeRate = 1.7%
Customer A — “Ideal Elevate Fit”
- Monthly spend S: $1,200
Steady, diversified card usage. - Average revolving balance B: $1,500
Carries a moderate but stable balance across months. - Benefit Cost BC: $150
Uses lounge, credits, and at least one Elevate experience. - PD: 2%
Low but not negligible default risk. - EAD: $1,800
Expected balance if they default. - LGD: 70%
Issuer recovers ~30% through collections/charge-offs. - EL:
- Overhead OH: $40
Servicing and operational costs. - CAC (annualized): $40
Acquisition cost spread across lifetime.
Revenues:
- IR = 1,500 × 0.24 = $360
- IC = 1,200 × 12 × 0.017 = $244.8 ≈ $245
- AF = $149
- GR = 360 + 245 + 149 = $754
Costs:
- BC = $150
- EL ≈ $25
- OH = $40
- CAC = $40
- Total cost = 150 + 25 + 40 + 40 = $255
RARPU(A):
Customer B — “Lighter User”
- S: $800/month
Lower spend, lower interchange. - B: $800
Smaller revolving balance. - BC: $120
Uses some perks, not all. - PD: 1.5%
Even safer than A. - EAD: $1,000
- LGD: 70% →
- OH: $40
- CAC: $40
Revenues:
- IR = 800 × 0.24 = $192
- IC = 800 × 12 × 0.017 = $163.2 ≈ $163
- AF = $149
- GR = 192 + 163 + 149 = $504
Costs:
- BC = $120
- EL ≈ $11
- OH = $40
- CAC = $40
- Total cost = 120 + 11 + 40 + 40 = $211
RARPU(B):
Customer C — “Too Risky for Elevate”
- S: $1,200/month
- B: $1,500
- BC: $130
Uses perks somewhat but not heavily. - PD: 8%
Much higher probability of default. - EAD: $2,000
- LGD: 80% →
- OH: $40
- CAC: $40
Revenues:
- Same as A: GR = $754
Costs:
- BC = $130
- EL = $128
- OH = $40
- CAC = $40
- Total cost = 130 + 128 + 40 + 40 = $338
RARPU(C):
On paper, still profitable — but PD is significantly higher. Depending on capital constraints and risk appetite, this customer might be excluded or routed to a more conservative product.
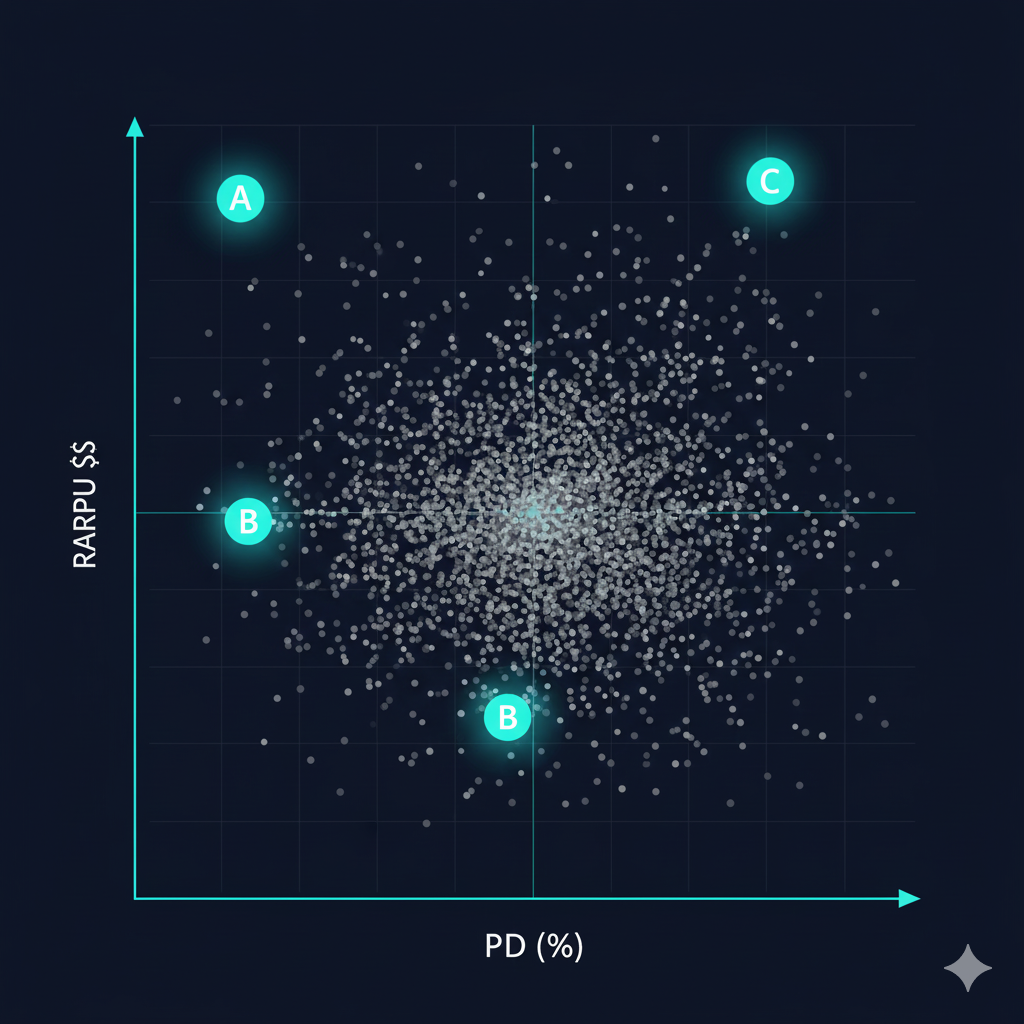
This is exactly why RARPU must be evaluated together with PD: you want high RARPU and acceptable risk.
6.6 Using the Framework to Choose Price & Perk Configurations
Now you’ve got all the components. Next step: systematically test pricing options.
Step 1 — Define a Pricing Grid
For example:
- Annual Fee (AF) ∈ { $99, $149, $199 }
- APR bands per risk tier ∈ { 22%, 23.5%, 25% }
- Perk bundles:
- Lite (Lower BC) – for Elevate 100
- Core (Moderate BC) – for Elevate 150
- Rich (Higher BC) – for Elevate 200
Step 2 — Simulate Each Grid Point
For every customer i in your sample:
-
Predict:
- PDᵢ, EADᵢ, LGDᵢ → ELᵢ
- RPᵢ → Bᵢ (avg revolve), Sᵢ (spend)
- Benefit usage → BCᵢ
-
Plug into the equations:
- IRᵢ = Bᵢ × APR (grid value)
- ICᵢ = Sᵢ × 12 × InterchangeRate
- AFᵢ = selected AF for that tier
- RARPUᵢ = (IRᵢ + ICᵢ + AFᵢ) – (BCᵢ + ELᵢ + OHᵢ + CACᵢ)
-
Aggregate by:
- Average RARPU per customer
- Portfolio-level PD, EL
- Segments: FICO bands, income, acquisition channel, etc.
Step 3 — Apply Constraints
Filter out pricing/benefit combos that violate:
- Portfolio PD limits
- Capital and loss-coverage constraints
- Fairness or regulatory guidelines (e.g., disproportionate impact on specific protected classes)
Step 4 — Identify Pareto-Optimal Sets
From the remaining combos, select those that are Pareto-optimal:
- You cannot increase RARPU without pushing PD above threshold, and
- You cannot lower PD significantly without sacrificing too much RARPU.
Typically, you’ll end up with:
- A core pricing set (e.g., AF = $149, APR band ~24%, Core perks)
- A down-tier (AF = $99, slightly smaller perks, slightly lower BC)
- An up-tier (AF = $199, richer benefits for customers with better metrics)
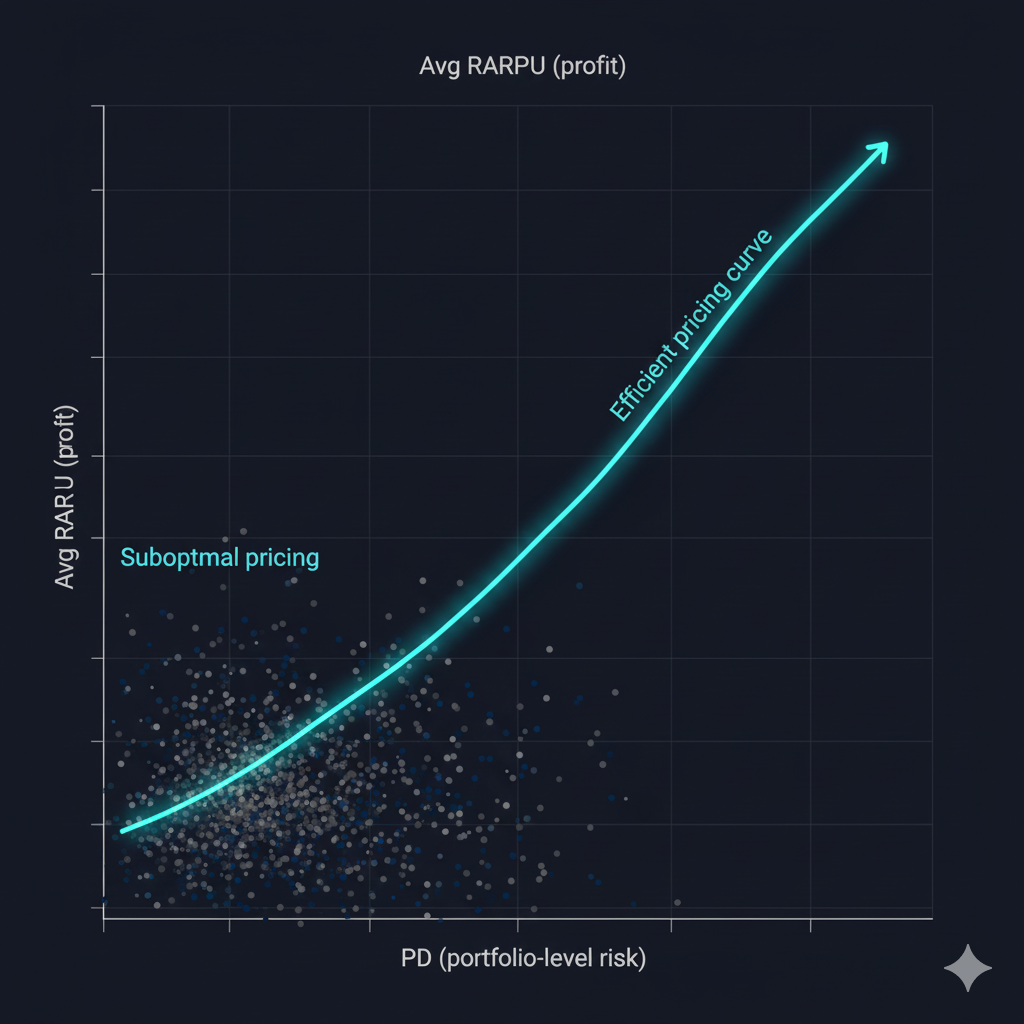
That’s exactly how you justify the Elevate 100 / 150 / 200 structure with data instead of vibes.
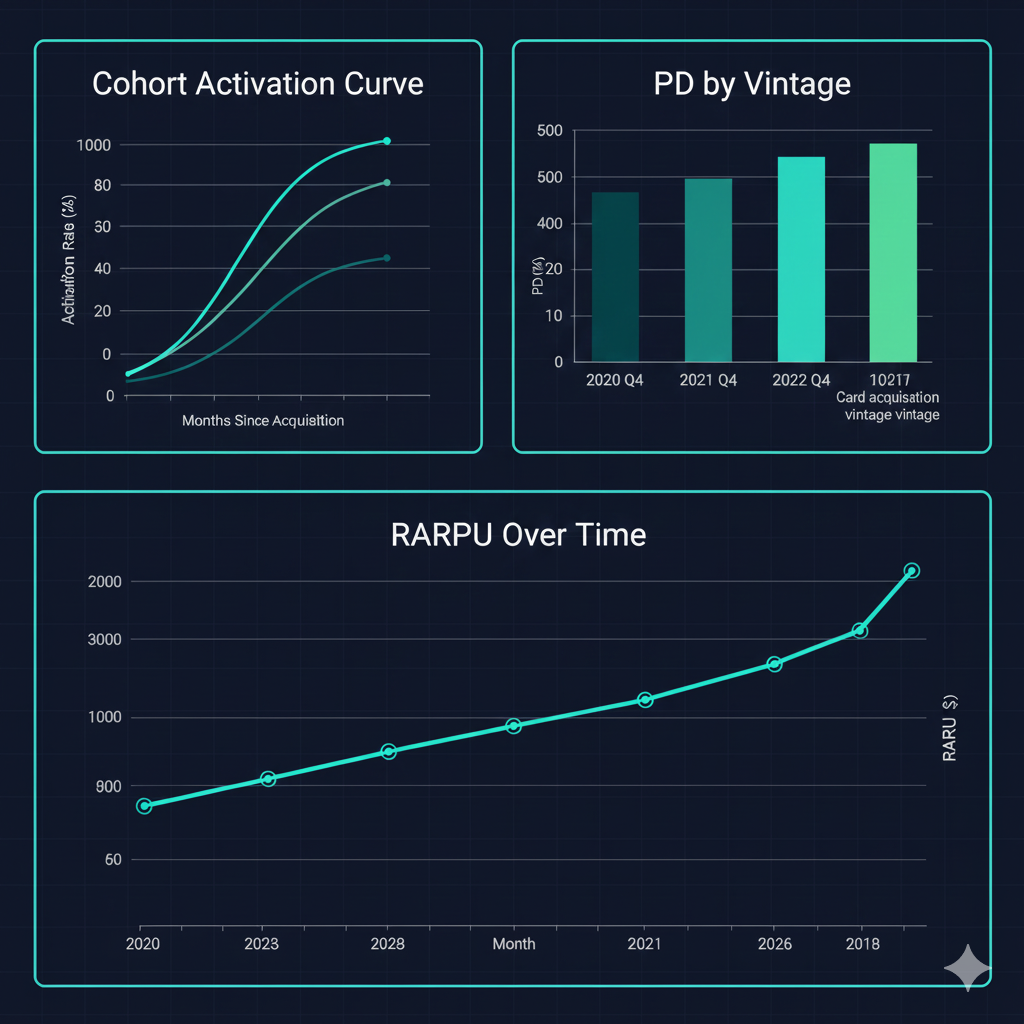
6.7 Implementation, Monitoring, and Iteration
Once Elevate launches, the work doesn’t stop; you move into continuous calibration.
Monitoring:
- Compare realized vs predicted:
- PD, EL, revolve behavior, IR, IC, BC
- Track by cohorts:
- Acquisition vintage
- Channel (branch, online, aggregator, co-brand)
- Tier (100 / 150 / 200)
Recalibration:
- Refresh PD and behavior models annually (or more often in volatile periods).
- Refine BC models as you observe real-world benefit usage.
- Kill underused or low-NPS perks; double down on high-NPS, low-cost ones.
- Adjust AF or perk stacks if RARPU and PD drift away from targets.
Strategic levers over time:
- APR reductions for long-term, consistently responsible Elevate users
- Upgrades to richer tiers or to true premium cards for top-performing segments
- Cross-sells to adjacent products (loans, checking, investing) once trust is built
This is how Elevate evolves from a static product into a dynamic, data-driven profit center.
7. Go-To-Market Strategy (After Pricing Is Locked In)
Once the pricing and economics are solid, GTM becomes surgical instead of generic.
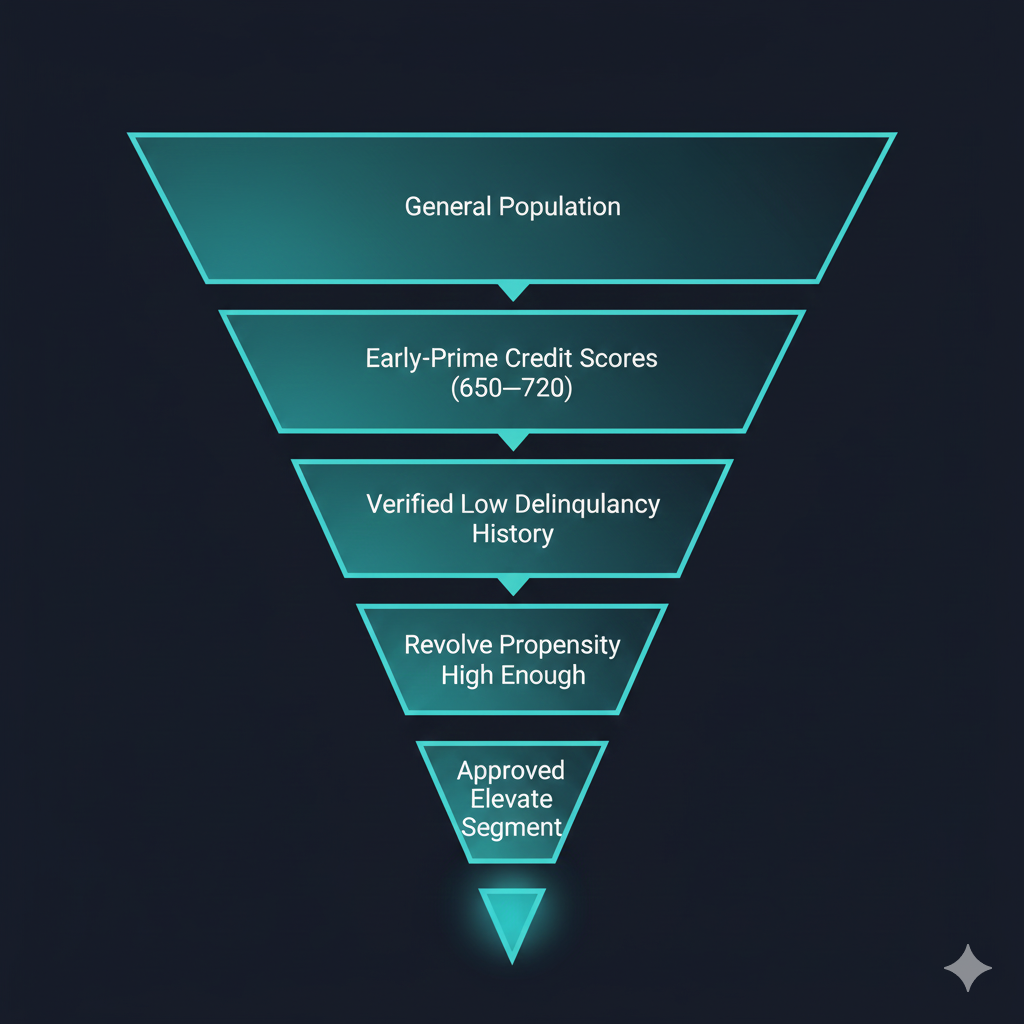
7.1 Targeting: Who Should See Elevate?
High-level filter logic:
- FICO between ~650 and 720 (early-prime band)
- Clean recent payment history (no serious delinquencies in last 12–24 months)
- Revolve propensity above threshold (e.g., RPᵢ ≥ 0.6)
- PD below threshold (e.g., PDᵢ ≤ 3–4%)
- Spend mix skewed toward categories where benefits shine (dining, travel, experiences)
These filters ensure:
- You’re not pulling in vulnerable subprime borrowers
- You’re focusing on aspirational, low-risk revolvers – the core Elevate segment
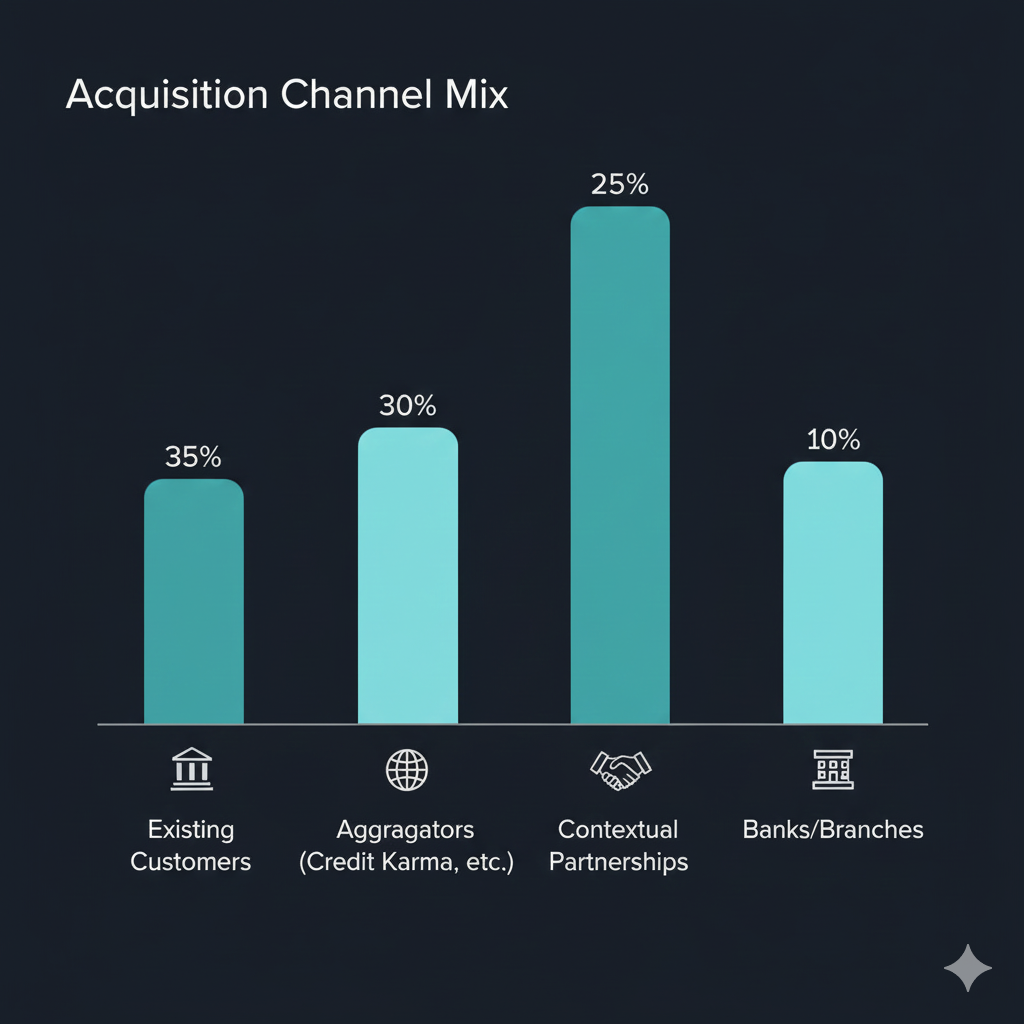
7.2 Acquisition Channels
1. Existing Bank Customers
- Highest signal density: you already know their payment behavior, spend mix, response to promos.
- Lowest CAC: in-app, email, and online banking banners are cheap.
- Easiest to pre-approve based on internal + bureau data.
2. Credit Aggregators & Marketplaces
- Platforms like Credit Karma, NerdWallet, etc.
- Position Elevate under categories like:
- “Premium-style perks with realistic fees”
- “Cards for responsible revolvers who want lifestyle benefits”
3. Contextual & Partnership Channels
- Airports (Wi-Fi portals, boarding pass check-in flows)
- Concert and event ticketing flows
- Rideshare and food delivery apps
- Employer and alumni program partnerships (young professional cohorts)
Each channel gets slightly different messaging and eligibility cuts, but the underlying economics are the same.
7.3 Messaging Strategy (Aspirational, Not Predatory)
You’re not selling debt; you’re selling access + fairness.
Examples of what to say:
- “Premium-style experiences at a price point designed for growing professionals.”
- “Lounge visits, curated experiences, and financial guidance — without needing a $550 card or a 780 score.”
- “Built for responsible cardholders still building their credit story.”
Examples of what not to say:
- “Enjoy life now, worry about payments later.”
- “Carry a balance and get rewarded.”
- “Buy everything on your card and deal with it someday.”
Tone matters, because it signals intent. Elevate’s positioning is:
“You’re on your way up. We’re building for that.”
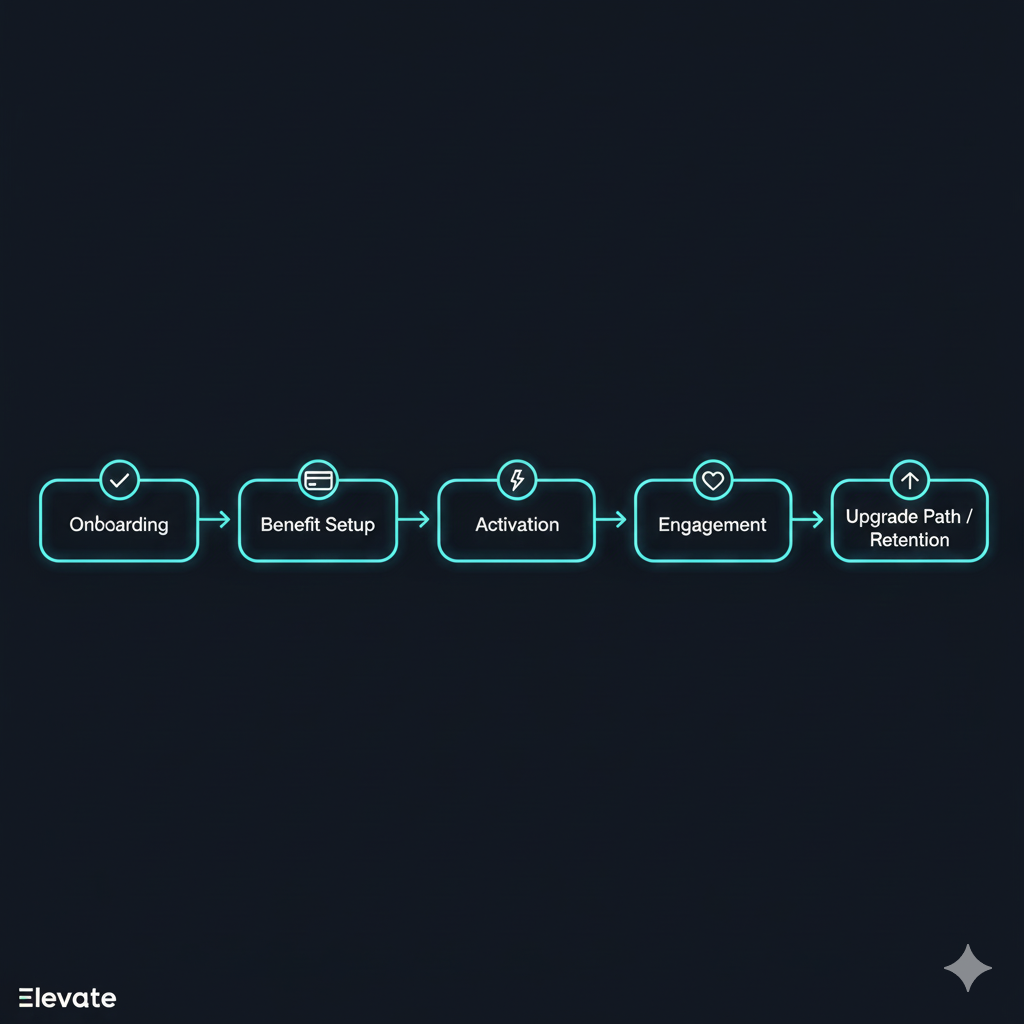
7.4 Activation & Early-Lifecycle Playbook
The first 3–6 months determine whether Elevate becomes:
- A primary card
- A “sock drawer” backup
- Or a short-lived experiment
Core activation levers:
-
Onboarding sequence:
- Guided setup for dining and transit credits
- Clear explanation of lounge access rules
- Nudge to book or explore one “Elevate Experience” in the first 90 days
-
Smart nudges:
- “You have a dining credit unused this month.”
- “You’re near an eligible lounge on your route.”
- “You’re eligible for a free Elevate Experience this quarter.”
-
Healthy behavior guidance:
- Education on how interest works
- Tools to simulate payoff time vs payment amount
- Encouragement to avoid sliding into minimum-only behavior
8. Ethics, Compliance, and Guardrails
Any card aimed at revolvers sits under an ethical microscope. That’s good — it should.
Elevate stays on the right side of the line by design, not by PR.
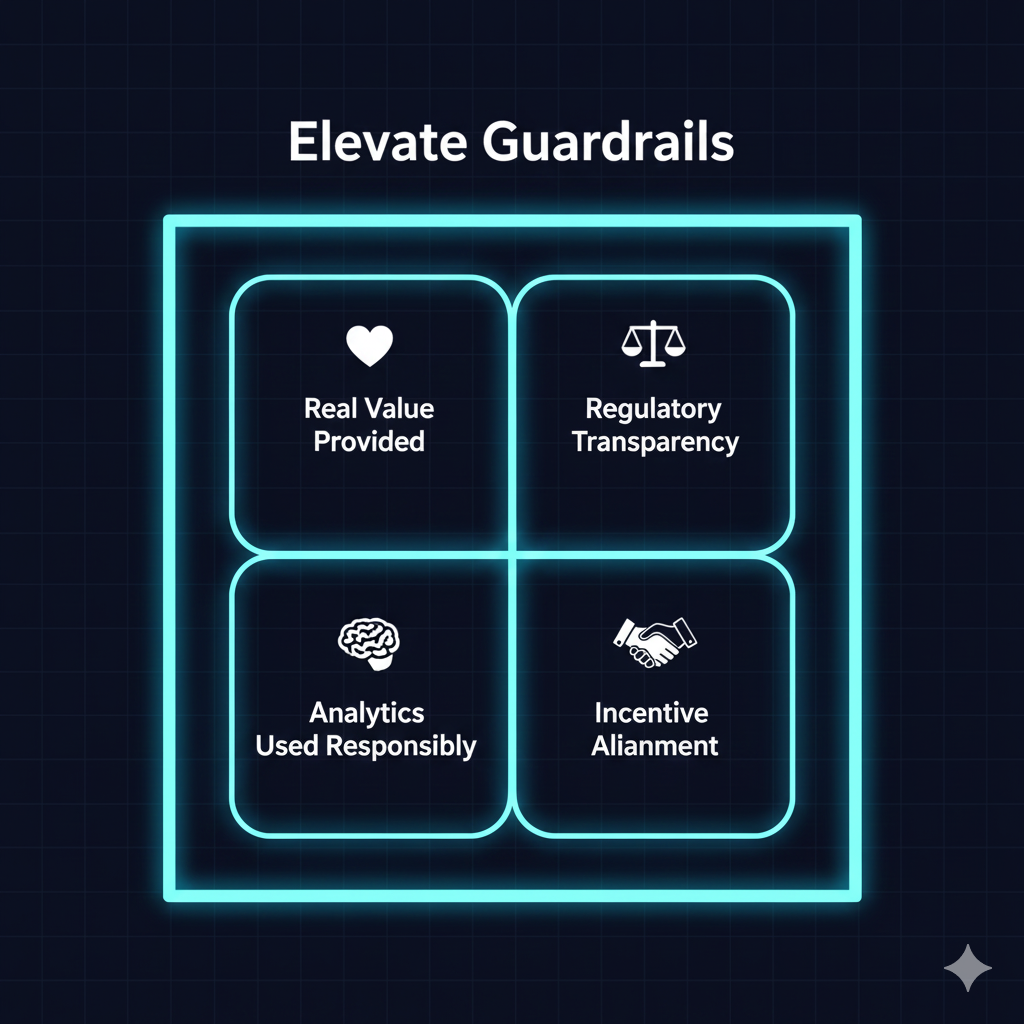
8.1 Four Guardrail Principles
-
Start With Real Value, Not Just Economics
- Lounges, lifestyle credits, curated experiences, and the Elevate Experience + Advisory
- Benefits customers actually want, not junk coupons buried in portals
-
Respect the Regulatory Framework
- Full, clear APR and fee disclosures under CARD Act rules
- No deferred-interest traps (“no interest if paid in full by X date, retroactive if not”)
- Late and penalty fees that are reasonable and capped
- Transparent balance-transfer terms without hidden surprises
-
Use Analytics to Protect, Not Exploit
-
Exclude customers whose PD is clearly outside safe bounds
-
Monitor behavior for signs of distress (DPD spikes, cash advances), and trigger:
- Proactive outreach
- Hardship programs
- Downgrade options to lower-fee, lower-risk products
-
Reward responsible behavior:
- APR step-downs after clean payment histories
- Pathways into better-priced products as scores and income improve
-
-
Align Incentives Over the Long Term
- Elevate is profitable even when customers stay healthy
- The business doesn’t rely on tricks like hidden fees or sudden repricing
- The issuer wins when customers engage and remain financially stable, not when they spiral
8.2 Positioning Elevate vs Truly Predatory Products
Compared to opaque 30%+ APR retail cards with:
- Confusing deferred interest
- Minimal benefits
- Aggressive fee schedules
…Elevate is:
- More transparent (clear APR, clear benefits, clear costs)
- More aligned (value proportional to fee)
- More supportive (advisory component + hardship pathways)
If built correctly, Elevate doesn’t “feed on” the middle class. It:
- Recognizes they already carry balances
- Offers them better value for the economics they generate
- Gives them tools to improve their financial trajectory over time
9. Conclusion: A New Tier for the Credit Middle Class
The credit middle class currently gets:
- Mid-tier cards that feel generic, or
- Premium cards they can’t justify or qualify for, or
- Store cards and subprime products that feel exploitative.
The Elevate Class Card is a different answer:
- $99–$199 annual fee
- 30–40% of premium-style perks
- Unique premium-plus privileges like the Elevate Experience + Advisory
- Data-driven, risk-adjusted profitability
- Transparent, ethical design
For the issuer, it’s a high-margin, analytically defensible new product line.
For the customer, it’s the first time the industry says:
“We see you. You’re not subprime. You’re not elite yet. You’re building — and you deserve something built for you.”
The bank that launches Elevate first won’t just add a card.
It’ll open up an entirely new tier in the credit ecosystem — and own it.